Introduction
In the vast universe of trading, every detail matters, every movement holds a story, and every line plotted on a chart can be the difference between profit and loss. Among these, the ‘cross’ of moving averages emerges as a beacon, signaling traders about potential market shifts. But what makes this cross so special? And how can one leverage its power for successful trading? At Botix, we delve deep into the science of trading, demystifying strategies, and unveiling the secrets of profitable trades. In this guide, we’ll take you on a journey through the intricate world of Moving Averages Cross, breaking down its nuances, and showcasing how you can craft a strategy that’s not just robust but also profitable. Whether you’re a newbie or a seasoned trader, there’s always something to learn in the ever-evolving realm of trading.

Understanding the Cross
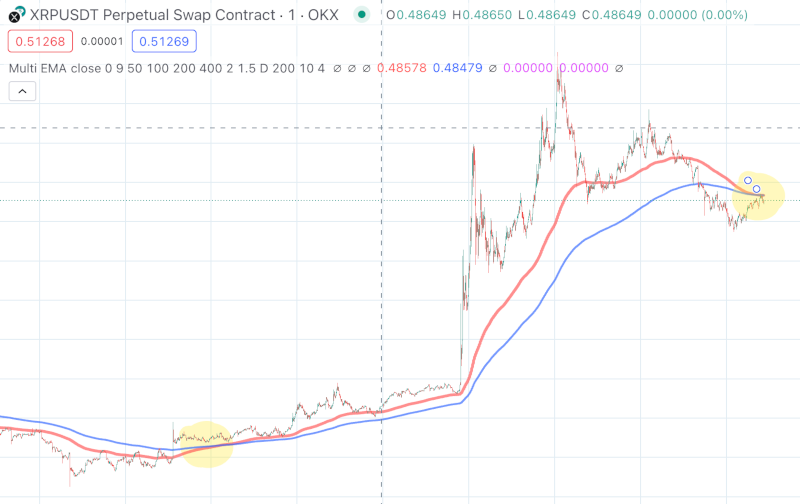
In the world of trading, a ‘cross’ holds significant importance. But what exactly is it? A cross, in simple terms, refers to the point where two plotted lines (often moving averages) on a chart meet or intersect. It’s a crucial signal for traders indicating potential buy or sell opportunities. For a more in-depth understanding of a ‘cross,’ Wikipedia offers comprehensive insights.
Why EMA? Picking the Optimal Moving Averages
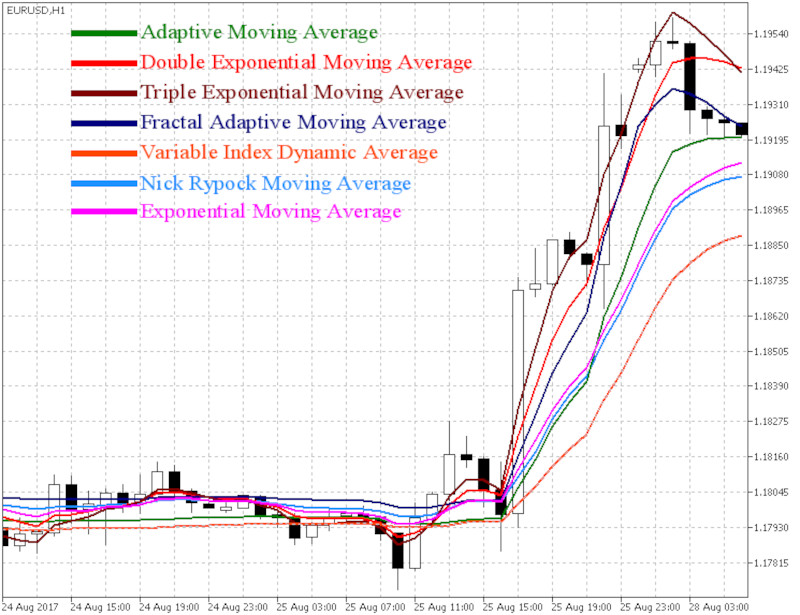
There’s a myriad of moving averages used in trading, from simple moving averages (SMA) to weighted ones. So, why choose the Exponential Moving Average (EMA)? EMAs offer more weight to recent prices, making them extremely sensitive to price dynamics, thus offering better results, especially in short-term volatility tradings. This sensitivity makes EMA an optimal choice for capturing quick market movements.

Selecting the Right Length for EMAs
Choosing the correct lengths for your EMAs is pivotal. The best lengths often hinge on your market type, its volatility frequency and rate, and your trading time interval (short, mid, long-term). For instance, using EMA200 and EMA400 with a 1-minute candle time interval becomes an excellent strategy for trading highly volatile cryptocurrencies like XRP or Doge. These specific lengths provide a balanced view of market trends, capturing both minor and significant shifts.
Complementing with the Right Indicators: Why RSI?
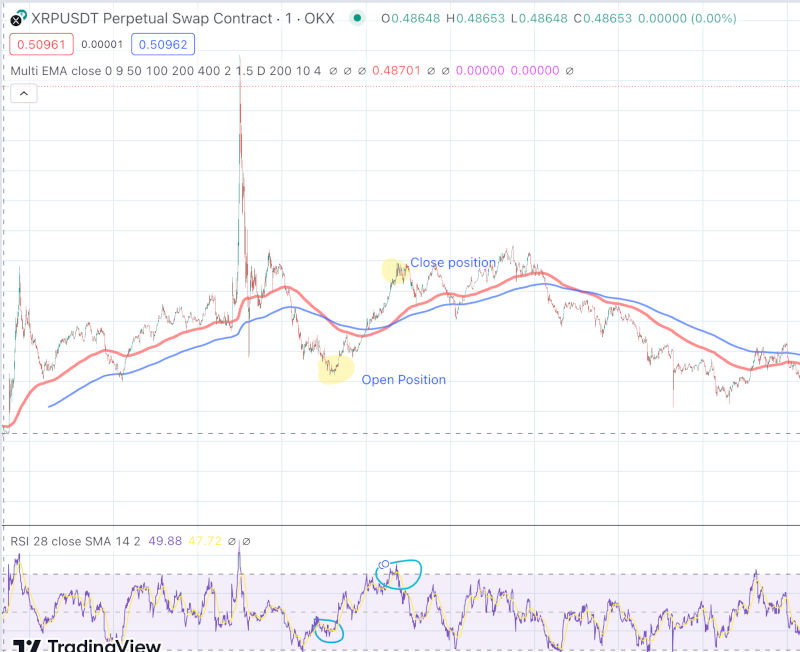
While the cross provides a signal, pinpointing the precise moment to enter or exit is paramount. Here’s where the Relative Strength Index (RSI) plays its part. The RSI measures the speed and change of price movements. By choosing RSI 28, traders can gauge the right momentum to open/close positions, especially in fast-paced markets. And if you’re looking to optimize momentum-based trading, don’t miss out on the offerings at Botix Momentum Trading.
Formulating the Entry: Decoding Open Position Conditions
When curating an algorithm for trading, it’s essential to precisely pinpoint the conditions that signify optimal market entry points. These conditions often leverage a blend of indicators that, when met, signify a heightened probability of a profitable trade. Here’s a more detailed look into the conditions set for our entry points:
Open Long: This is about capitalizing on an upward trend. We initiate a long position when:
- There’s a positive EMA cross, indicating a bullish momentum.
- EMA200 is less than EMA400, reinforcing the bullish trend.
- The previous RSI value was below 40, indicating the asset was potentially oversold, hence, an upcoming bullish reversal.
- The current RSI is greater than the previous, adding further confirmation to the potential upward trajectory.
Open Short: Conversely, this focuses on benefiting from a potential decline. The conditions for this are:
- A positive EMA cross but in a scenario where the longer-term average (EMA400) is dominant, hinting at a bearish momentum.
- EMA200 being greater than EMA400, which signifies the potential start of a bearish trend.
- The previous RSI value was above 60, suggesting the asset was potentially overbought and due for a correction.
- A declining RSI further affirms the bearish momentum.
Such meticulous conditions are the backbone of successful algorithmic trading. The careful integration of both EMA and RSI gives traders a dual-lens view of the market – understanding both trend direction (from EMA) and momentum (from RSI). This dual approach ensures a higher accuracy rate, optimizing each trade’s potential for profit. For those eager to harness such precision in their trading endeavors, turning to industry experts like Botix can be a game-changer.
Crafting the Exit: Grasping Close Position Conditions
Before diving into trades, planning your exit strategy is crucial. Here’s the blueprint:
- Close Long: Terminate a long position when the RSI exceeds either 70 (if EMA50 has a positive slope) or 60.
- Close Short: Terminate a short position when the RSI goes below either 30 (if EMA50 has a negative slope) or 40.
Exiting at the right moment maximizes profits and minimizes potential losses. Remember, strategy is everything in trading.

In Summary
Crafting a trading strategy centered on moving averages and their cross can significantly enhance your trading outcomes. By understanding the intricacies of EMAs, selecting appropriate lengths, and complementing with indicators like RSI, you’re setting up for success. And if you’re keen to dive deeper into algorithmic strategies, Botix is here to guide you every step of the way. Dive into our comprehensive guide on algorithmic trading. If custom trading bots are what you’re after, don’t hesitate to contact Botix. We’re experts in tailoring bots to a myriad of market conditions.
